Table S1. A csv file with VS30 values for K-NET stations, estimated from the equations relating VS30 to VSZ in Table 2 of the text, derived from KiK-net models, and in Table 2 of Boore (2004), derived from California velocity models. In these estimations z is the depth to the bottom of the velocity model at each site (zmax). The file includes the following columns, with the units indicated at the end of each description:
Table S2. A csv file containing names of those K-NET stations without valid velocity models.
Figure S1. Histograms of the various estimates of VS30 at K-NET stations; also shown are the lines corresponding to 10, 50, and 90 percentiles of the combined estimates. The mean of the log values of the combined estimates is the equivalent of 337 m/s (log values are shown in the graph because the VS30 values have a log-normal distribution, as shown in the article).
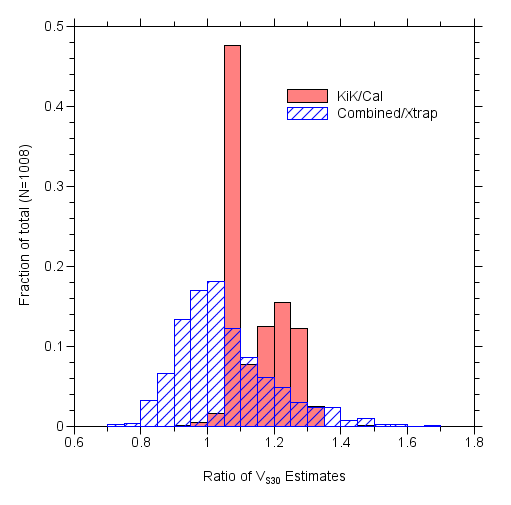
Figure S2. The histograms of the ratios of the various estimates of VS30. "KiK", "Cal", "Combined", and "Xtrap" are estimates from the KiK-net equations, the California equations, the weighted combination of those estimates (see above) and the constant-velocity extrapolation, respectively.
Boore, D. M. (2004). Estimating VS(30) (or NEHRP Site Classes) from shallow velocity models (depths < 30 m), Bull. Seismol. Soc. Am. 94, 591-597.
[ Back ]